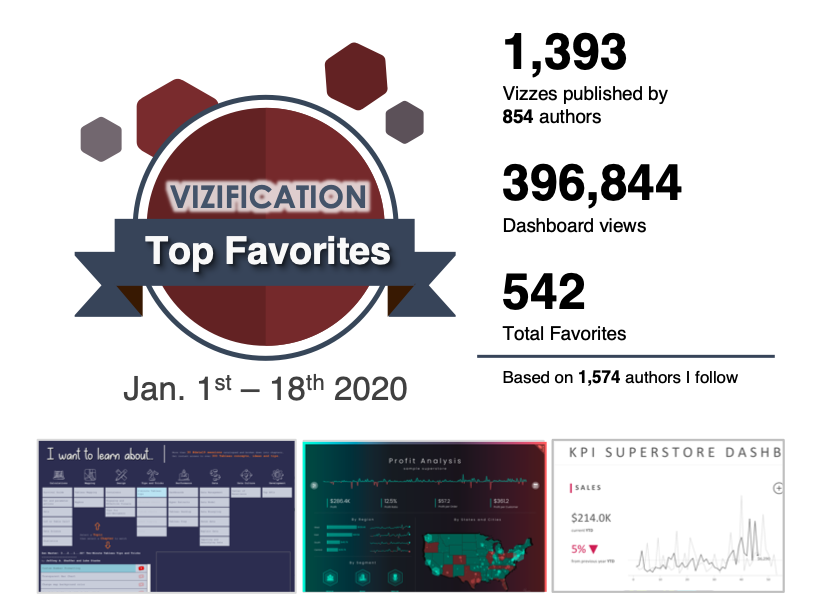
1.) I want to learn
by George Gorczynski
2.) Profit Analysis – Sample Superstore
by Pradeep Kumar G
3.) KPI Superstore Dashboard
by Fuad Ahmed
4.) America’s Favorite Sport
by Fred Najjar
5.) Flow to Net Profit – Daimler P&L 2014-2018
by Klaus Schulte
6.) Stock Market Overview – Nested Treemap
by Dorian Banutoiu
7.) Japanese Architectural Heritage
by Alexander Varlamov
8.) 2019 Viz in Review
by Josh Tapley
9.) Introducing #20for20Tableau
by Sean Miller – @HipsterVizNinja
10.) Inception
by Zach Bowders
11.) Doctor Who | Episode Ratings
by Maria Brock
12.) Rematch – Joshua v Ruiz – Clash On The Dunes
by Simon Beaumont
13.) Road Names in Cincinnati
by Spencer Baucke
14.) [Template] Voronoi Treemap
by Tristan Guillevin![[Template] Voronoi Treemap](https://i0.wp.com/public.tableau.com/static/images/Vo/VoronoiTreemapTemplate/VoronoiTreemapTemplate/1.png?w=450&ssl=1)
15.) Vietnam Draft Lottery
by John Emery
16.) Equal-Width Sankey Template
by Ken Flerlage
17.) Searching for a Hospital in Liberia – #ProjectHealthViz
by Lindsay Betzendahl
18.) My Makeover Monday Vizzes 2019
by Meera Umasankar
19.) Collaboration – Australia Bushfire
by Meera Umasankar
20.) Smoky Sydney – Air Quality in New South Wales
by Pris Lam
21.) Australia bushfires
by Clélia Boursin Bellot
22.) The movies of the decade
by Kimly Scott
23.) Rematch – Joshua v Ruiz – Clash On The Dunes
by Samuel Parsons
24.) Trump Face
by Adam E McCann
25.) England & Wales Car Theft
by Naresh Suglani
26.) United States Fail to Ban Harmful Pesticides
by Pablo Gomez
27.) Jamie Vardy is Having a Party (again)
by Sam Trigg-Petrović
28.) Top 20 Football Clubs by Revenue_2018/19_English Clubs
by daniel ling
29.) Superstore Sales KPI Dashboard
by Jacqui Moore
30.) Tableau Magic / Education and Social Engagement 2019
by Toan Hoang / Tableau Magic
31.) America’s Most Popular Sports | #MakeoverMonday 2020.1
by Kate Schaub
32.) Superstore Product Sales Variance 2018-2019
by Klaus Schulte
33.) Makeover Monday 2020 Week 2 Harmful Pesticides in the US
by Meera Umasankar
34.) Gaining Ground: Soccer Grows in the U.S.
by Pablo Gomez
35.) Chinese Paddlefish
by James Goodall
36.) The Shapes of the PGA Tour
by Chris DeMartini
37.) Twitter Analytics
by Mark Bradbourne
38.) Antarctic vs Arctic School Project
by Santi and Pablo Gomez
39.) US Unemployment Rate
by Fred Najjar
40.) My Year In Books
by Naledi Hollbruegge
41.) Rain vs Fire in Australia
by Wendy Shijia
42.) #WOW2020 Week 2 | Beautiful & Dynamic Bar Chart
by Ann Jackson
43.) Australian Wildfires
by Maria-Alexandra Ilie
44.) My IronQuest Vizzes 2019
by Meera Umasankar
45.) 1896 – 1996 : Europe Countries Average Height | #VOTD
by Mohit Panse
46.) Connecticut Drug Deaths_ProjectHealthViz-Jan19
by Riddhi Thakkar
47.) Completion Gantt Chart
by Toan Hoang / Tableau Magic
48.) Interactive Resume
by Young C. Song
49.) OPERATION FISTULA
by Aquinov “Akky” Mathappan
50.) Makeover Monday 2019 Downloads
by Chantilly Jaggernauth
51.) Prison Overcrowding Around The World #IronQuest
by Mateusz Karmalski
52.) India Population
by Meera Umasankar
53.) PHV-IQ-January2020v1
by Michelle Frayman
54.) Sesame Street Sponsors
by Neil Richards
55.) 商场业态占比/店铺信息V_1.0
by Yuri_Wg
56.) Properties Sold 2019
by James Goodall
57.) Website Analytics, An Infographic
by Lali Jularbal
58.) greatified.com – Curvy Line Charts
by Ludovic Tavernier
59.) Transport CO2 Emissions in Europe
by Naresh Suglani
60.) Paying the President (MOM week47 2018)
by Satoshi Ganeko
61.) Trigonometry
by Alexander Philipeit
62.) Tweets Tracker of Popular #
by Amandeep Saluja63.) “Assist Network Chart” (2019-20 NBA Season)
by Baljinnyam Enkhtur
64.) Good Shows, Bad Endings and Good Shows, Good Endings
by Bo McCready
65.) Copyright Violations on Google
by Christopher Marland
66.) A Walk in My Shoes – Steps 2015 to 2019
by David C. Velleca
67.) UC Lindner Business College Map
by Jeffrey Shaffer
68.) fire and density of population
by Marc Psaila
69.) Makeover Monday 2020 Week 1 American’s Fav Sports
by Meera Umasankar
70.) #Iron Quest – Where does my local supermarket source it’s produce?
by Ryan Lowers
71.) America’s favorite sports (MOM week1 2020)
by Satoshi Ganeko
72.) mom_2020w01
by Yuta Sakai
73.) What is your favourite sport to watch? – #MakeoverMonday Week1
by Zunaira Rasheed
74.) National Capital Territory of Delhi – 20 Million in 2020
by Allan Walker
75.) Airline-Andy Huang
by Andy Huang
76.) Land Use In American States
by Bo McCready
77.) Stuck: Mental Health of Aboriginal and Torres Strait Islander people in jail
by Frederic Fery
78.) MakeoverMonday in Review
by Ian Conlon
79.) Philippine Earthquakes
by Lali Jularbal
80.) The USA Lags In Banning Harmful Pesticides
by Luca Urzì
81.) MM2020Week1v1
by Michelle Frayman
82.) Where We Went 2019
by Michelle Maraj
83.) Tableau (verb)
by Mitchell Grewer
84.) What is America’s most popular sport? – 2020 Week1 #makeovermonday
by Naresh Suglani
85.) How Britain Voted: 2019
by Neil Richards
86.) USA State to State Migration in 2018
by Rob Radburn
87.) DataRevelations Synchronized Scrolling
by Steve Wexler
88.) Gradient Backgrounds
by Toan Hoang / Tableau Magic

UK Rainfall
by Adam Green
Tableau Public and Twitter Dashboard
by Amandeep Saluja
Major League Baseball Team Attendance in 2019
by Bo McCready
NBA Salaries Vs the Cap_#MakeoverMonday_2018.29_v2
by daniel ling
Interactivity 101
by David C. Velleca
“Rocket” Ronnie: The Fastest Ever 147 Break
by David Hoskins
What is America’s Most Popular Sport
by Frances Okolo
FOX Copyrights Infringements 2012-2019 | Dashboard Week Day 2
by Juliana Camparotti
Year2020 First Research:Gaussian Curve
by linxujia
#TableauTipTuesday 2020 Week 1 – Dual Triangle KPI
by Lorna Eden
US Fails to Ban Harmful Pesticides #MakeoverMonday
by Mark Bradbourne
Can you build a beautiful and dynamic bar chart
by rgauna
The-Big-Mac-Index |-366-vizzes
by Rodrigo Calloni
200 in 2020
by William Watkins
The journey of Asteroid Explorer Hayabusa2 【和Viz】 小惑星探査機はやぶさ2の航海日誌
by Yoshihito Kimura
